로그인
Mathematics for IGCSE & O level - Statistical Diagrams (Section 2 - No. 41)
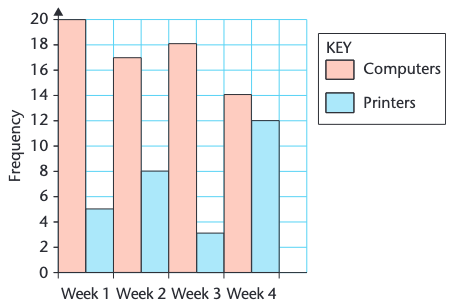
In which week were the most printers sold?
Week 1
Week 2
Week 3
Week 4
설명
The blue bar, representing printers, is highest in Week 2.
댓글 (0)
댓글을 달려면 로그인하세요
광고
자바스크립트가 이 페이지를 올바르게 로드하도록 허용